
Slimmed-down council committee meetings in the time of COVID mean that a whole set of documents that used to be presented to committee members for discussion are now just sent round by email for information.
The latest batch are the quarterly performance reports for council functions which fall under the remit of the new Environment & Sustainability Committee – and a few of the charts caught my eye.
Local bus passenger journeys originating in the local authority area
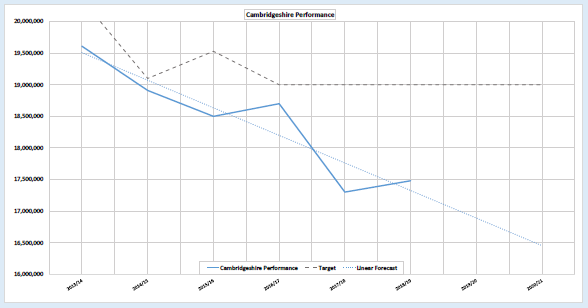
A sad story of decline, with over two million fewer journeys a year than in 2013/14. This figure is only updated once a year, in the summer, so the most recent result isn’t in yet, and will presumably be artificially low because of COVID. But here’s the parlous state of public transport in Cambridgeshire, in a single graph. The text supplied with the graph optimistically describes performance as ‘improving’ because of that last uptick of the solid blue line. But it isn’t, is it, really? Even the council admits that this glimmer of hope is probably just something to do with lifting the charge for parking at the park and rides.
Growth in cycling from a 2004/05 average baseline
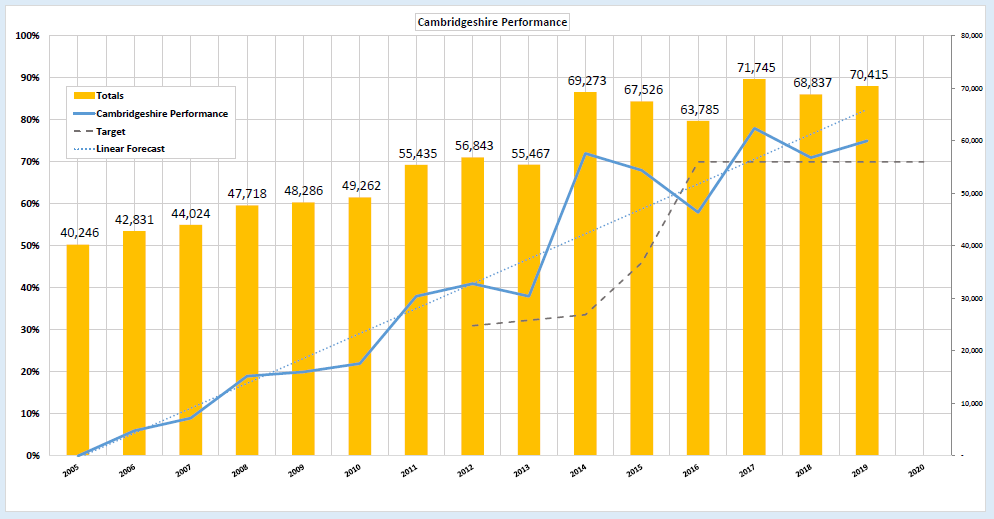
Wow those columns are growing well! But why has the target (thicker dotted line) not changed for the last four years? Surely, and especially now in the time of COVID with pop-up cycle lanes and so, on, the council needs to be more ambitious than this? And the real step-change happened in 2014 – there’s been no real improvement since then. This is an annual figure again, so it will be interesting to see what the current year performance is when it comes in.
Traffic entering and leaving Cambridge
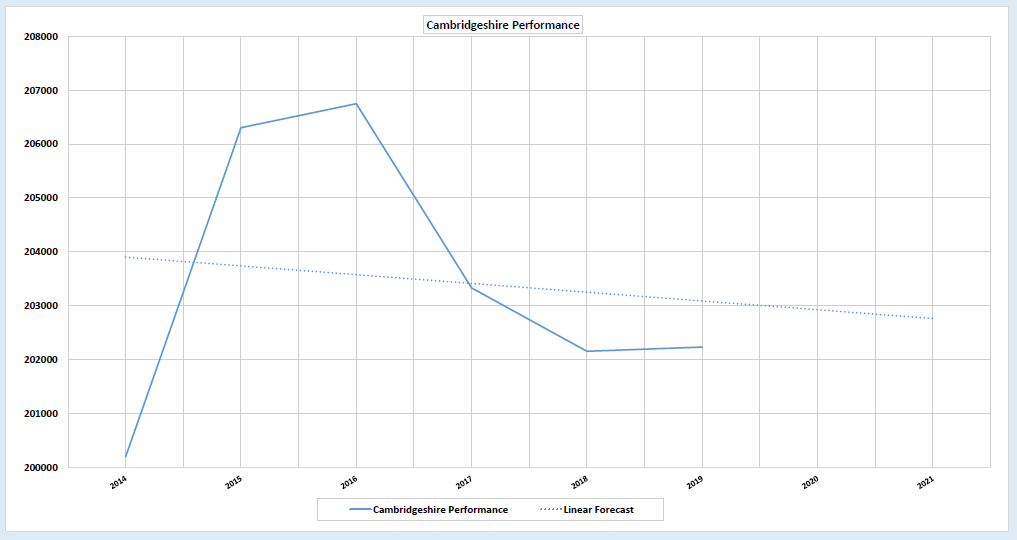
The scale goes from 200,000 vehicles at the bottom, to 208,000 at the top – and it’s a snapshot of a twelve-hour day on the first Wednesday in October. So that’s a small increase, and an even smaller decrease, and 2,000 more vehicles entering and leaving Cambridge than six years ago. Another annual figure – the 2020 data will be available in November. How much of the positive traffic-reducing effect of lockdown will have dissipated by then? Or will we be in the middle of lockdown #2?
Changes in traffic flows within Cambridge
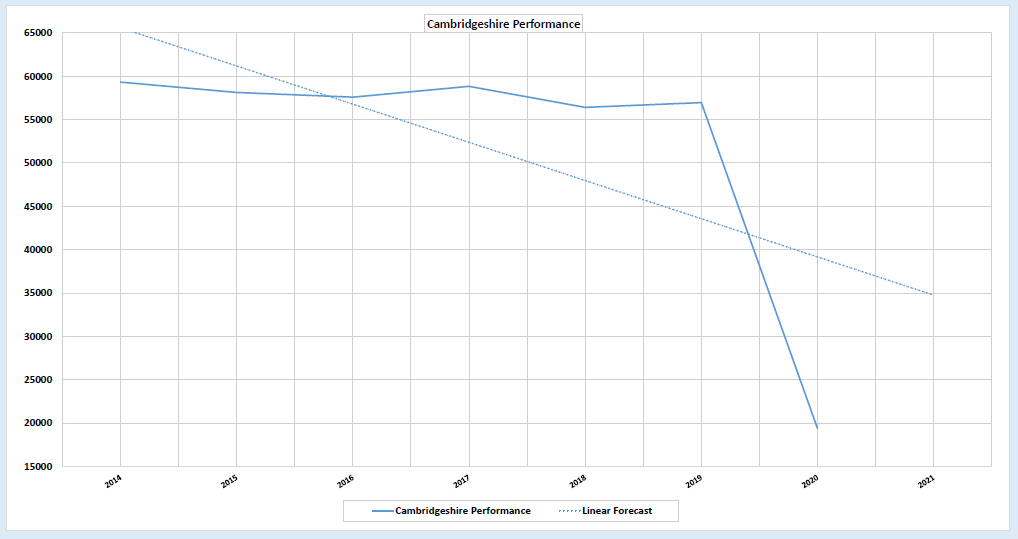
By way of comparison, this is what lockdown looks like. This measure is the number of vehicles crossing the River Cam bridges within Cambridge in a single twelve-hour day, in May. This shows a a 66 per cent reduction, pretty obviously COVID related. How much of this vehicle traffic will bounce back next year?
Freedom of Information requests answered within 20 days
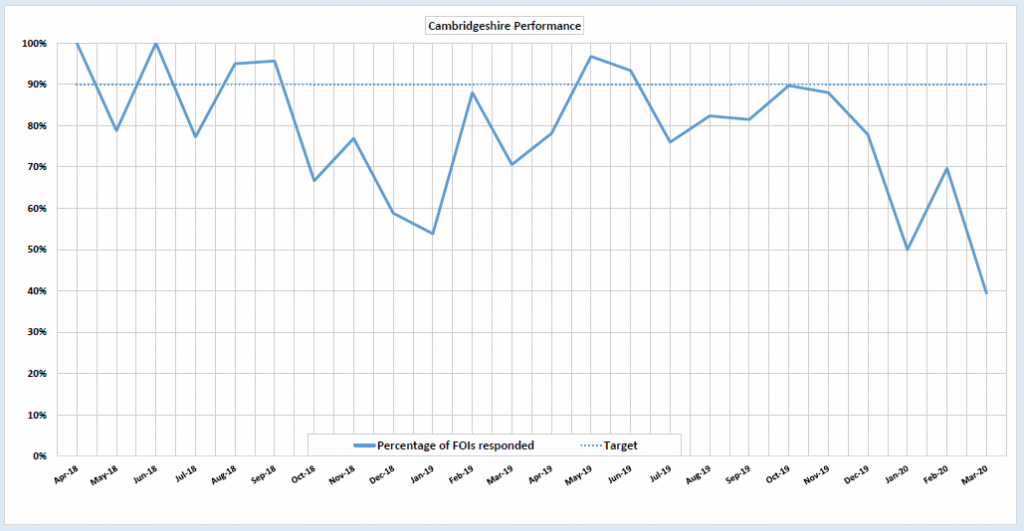
Ooh, COVID or no COVID that fall-off in performance doesn’t look good. Not surprisingly, reports against this indicator will be made to senior officers fortnightly for the next six months to ensure performance improves.