
Cambridgeshire County Council’s Public Health intelligence team has been collating statistics on Covid-19 in the county.
Here are some of the headlines this week, with figures to 25 May 2020 unless otherwise stated.
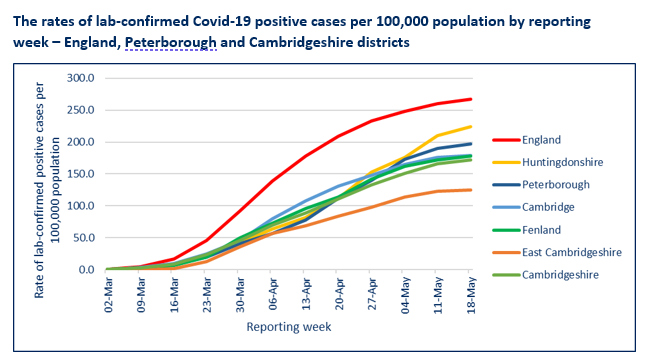
- There have been 1,122 laboratory-confirmed cases of Covid-19 in Cambridgeshire. That’s 172.2 per 100,000 population, which is considerably less than the England average of 267.6. East Cambridgeshire has the lowest rate in the county, with 112 confirmed cases – and has had the lowest rate in Cambridgeshire since the week beginning 2 March. (Of course this only relates to tested and confirmed cases).
- The week starting 6 April 2020 had the largest number of new cases of Covid-19 in Cambridgeshire. In the most recent three weeks, numbers have continued to decline. The highest number of new cases in Huntingdonshire was later, in the week beginning 27 April.
- 365 deaths related to Covid-19 occurred among Cambridgeshire and Peterborough residents between 27 March and 15 May. The lowest number of those (45) was again in East Cambridgeshire.
- For the week ending 15 May 2020, all districts except Cambridge have experienced a greater number of (all-cause) deaths than their 2014-18 averages. In East Cambridgeshire, Fenland and South Cambridgeshire, the number of deaths is greater than their 2014-18 averages, even with Covid-19 deaths excluded.
- 48.9 per cent of care homes in Cambridgeshire have reported a suspected or confirmed outbreak of Covid-19. Once again, East Cambridgeshire has the lowest in the county, at 33.3 per cent.
- The Care Quality Commission was notified of 277 deaths from all causes in Cambridgeshire care homes between 10 April and 22 May 2020. 88 (one-third) of those deaths were Covid-19 related.