District councillor for Sutton, Mepal, Witcham, and Wentworth (East Cambridgeshire District Council) and county councillor for Coveney, Little Downham, Mepal, Pymoor, Sutton, Wardy Hill, Way Head, Witcham, and Witchford (Cambridgeshire County Council)
The following planning applications in the Sutton division have been published by East Cambridgeshire District Council.
22/00042/FUL Sutton 1 Link Lane Sutton CB6 2NF Conversion of existing garage to annexe accommodation and construction of alterations to the infrastructure.
22/00057/RMM Sutton Land rear of Garden Close Sutton CB6 2RF Reserved matters for appearance, landscaping, scale and layout for 51 homes including public open space of previously approved 17/01445/OUM outline planning application for up to 53 houses to include public open space and details relating to access.
22/00058/ADI Sutton 21 Ely Road Sutton CB6 2QD Installation of internally illuminated fascia and projection sign (retrospective).
21/01787/RMA Witchford Land parcel south of A142 Common Road Witchford Reserved matters approval for development of six dwellings and associated landscaping, drainage and ancillary works, of previously approved 18/00820/OUM outline planning application for up to 116 dwellings with noise barriers, public open space, landscaping, sustainable drainage system (SuDs) and vehicular access points from Common Road and Manor Road. All matters reserved except for means of main vehicular access.
Further information can be found on the district council’s planning pages. If you would like to respond formally to the council about any planning application, comments should be addressed to the district council and not to me. Comments may be made
online using the council’s public access web page (the link above);
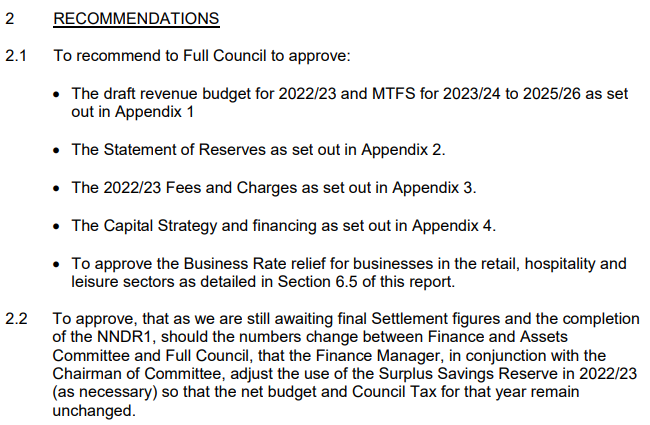
The draft budget outlined a number of proposals, including
Stopping saving up to repair or refurbish the A10 Leisure Centre, but spending the money on ‘other leisure providers across the District’
Creating a £100,000 fund for its ‘CLTs’ (East Cambs cut itself adrift from the Combined Authority’s CLT programme and is going it alone)
Increasing the Council’s share of council tax by £5 per year for a Band D household – up from £142.14 to £147.14
However, late on Friday afternoon we were told this entire recommendation is to be scrapped. Instead, a proposal will be made by Conservative councillors Anna Bailey and Bill Hunt, deleting the entire recommendation.
The effect of this is that the Finance & Assets Committee will make no proposals at all to the Council’s budget meeting on 22 February.
A £5 increase in Council Tax would net £155,576 in additional revenue in 2022/23. In recent years East Cambridgeshire has experienced a council tax freeze of Narnian proportions. Cllrs Bailey and Hunt are clearly keen for that to continue, meaning they expect to find that £155,576 somewhere else.
We’re waiting to see the rabbit they intend to pull out of the hat on Budget day.
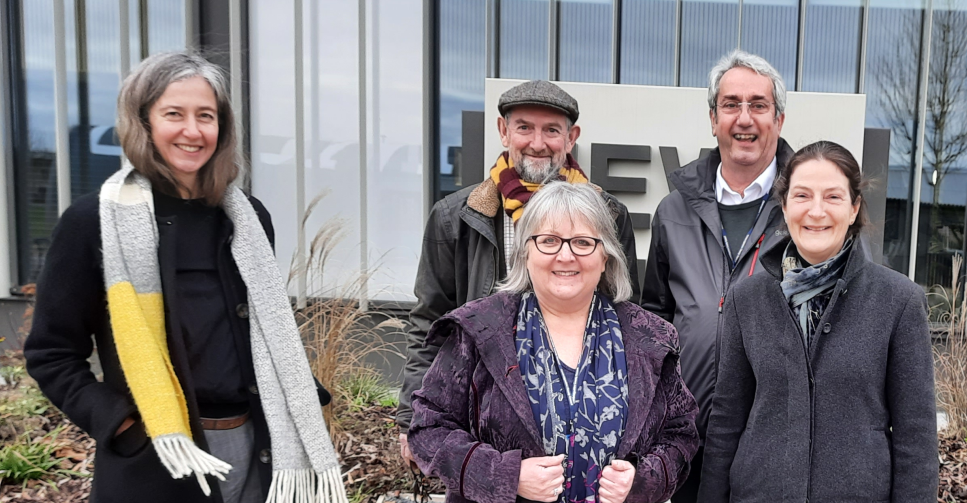
The Liberal Democrat Environment & Green Investment team – from left to right, Cllrs Ros Hathorn (Histon & Impington), Piers Coutts (Ely South), Lorna Dupré (Sutton), Brian Milnes (Sawston & Shelfords), and Anna Bradnam (Waterbeach)
Carbon footprints, decarbonisation funds, local area energy planning, Greater Cambridge’s emerging Local Plan, and digital strategies, all featured at today’s Environment & Green Investment Committee meeting.
A report on the carbon footprint of Cambridgeshire County Council, and of the county as a whole, was the first item on the agenda. 2020/21 was an unusual year, with Covid lockdowns and reduced economic activity. So it’s not surprising that the Council’s carbon emissions from its own sites and assets, and from its purchased electricity, were down twenty per cent on the previous year. Adding in indirect emissions, from the activities of the Council’s contractors and suppliers, the Council’s carbon emissions were down a staggering forty per cent. Much of that drop is likely to be temporary.
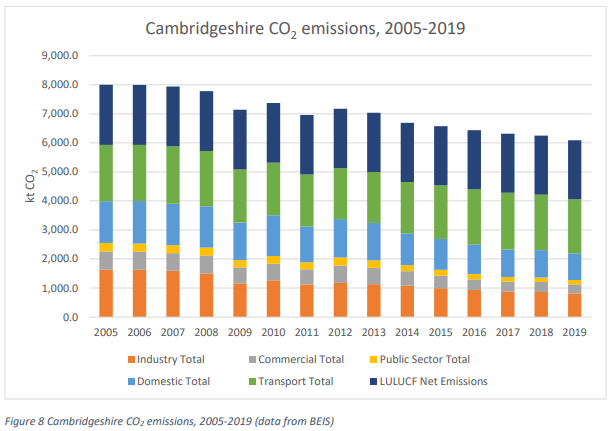
The most recent carbon figures for Cambridgeshire as a whole are from 2019, and show a steady decline.
Most of this is due to the decarbonisation of electricity generation for domestic, commercial and industrial use.
The next two items were reports from postgraduate students at the University of Cambridge. They are part of the CUSPE scheme – Cambridge University Science & Policy Exchange. This enables students to volunteer for a short term project to inform the Council’s policies and strategies. It’s good for the Council’s policy development, and good for the students too.
The first report was on the potential for a Decarbonisation Fund. This would help local businesses offset those last difficult-to-eliminate carbon emissions by buying locally generated carbon credits. It was clear to the students as they began work that what businesses also needed was reliable and trustworthy information. So part of their recommendation was for the Council to talk to partners about setting up a decarbonisation advice service. They also recommend the Council’s flagship energy project at Swaffham Prior to be first to put itself through the process of earning those carbon credits.
The second report was on the potential for creating local heating networks in Cambridgeshire’s market towns, to put large numbers of homes and buildings onto renewable energy. Huntingdon, March, and Ely were chosen as examples. In a way this was a more complex proposal. The next steps here will involve conversations with local planning authorities and the Council’s partners.
The Committee also discussed the officers’ response to the first proposals for the new Greater Cambridge Local Plan. One of the issues that attracted most discussion was the likelihood that formal sports facilities to serve the new population of the North East Cambridge area development would not be included on-site. It seemed problematic that a new community designed to accommodate very few cars would not locate sports facilities in easily reachable distance.
Finally there was a lively conversation about Connecting Cambridgeshire’s latest digital connectivity strategy. One element of this was preparation for the copper switch-off in 2025. Old copper networks will be phased out and start to be replaced with digital systems delivered over broadband connections. “This will affect all public services, businesses and domestic premises, making people even more reliant on digital connectivity and will require signposting and awareness raising, particularly among those who do not use mobile phones, or cannot access the internet,” says the report. Many homes still rely on this network. But so do a great many specialised applications such as alarm lines, payment terminals and health-monitoring equipment. Many older telephone systems, fax machines, payment terminals and alarms that do not have SIM card capability will no longer work after the 2025 deadline. Councillors including Cllr Ros Hathorn (Histon & Impington) weren’t sure everyone who needed to know was aware of this impending issue.
The County Council’s Environment & Green Investment Committee, which I chair, will receive the county’s latest carbon footprint report on Thursday 20 January.
The report includes the following comparison of carbon emissions between the Cambridgeshire districts.
It’s interesting to note the very obvious differences between the different districts. These include the huge contribution of LULUCF (that’s Land Use, Land Use Change, and Forestry) in East Cambridgeshire and Fenland. And of course the similarly very significant contribution of transport in Huntingdonshire and South Cambridgeshire. Without these two major pressures, Cambridge’s footprint is very much smaller – just one-third that of Huntingdonshire, which is the largest.
Given its current position, it will be interesting to watch Huntingdonshire District Council achieve its recently adopted target of net zero for the district by 2040. That’s just eighteen years away. If it can achieve this, it will be a considerable help to the county as a whole, where emissions from peat in the rural areas will be a real challenge.
This is the seventh and last in a series of posts about the ‘carbon footprint’ of the various parishes in the Sutton division. It uses https://impact-tool.org.uk/ which is a parish-level carbon emission estimator. This gives parishes and small communities usable data on their carbon emissions – the amount of carbon (or equivalent gases like methane) produced by our activities.
Territorial emissions are those directly produced by the parish – its buildings, transport, land, and other amenities.
Consumption emissions include the carbon from the things we buy and use which are brought into the parish from elsewhere.
The website also shows carbon emissions for each of those two options in total, and also per household. You can also compare parishes with other parishes in the area, with the district council average, and with the national average.
So, Witchford, which generates just over two per cent of East Cambridgeshire’s total carbon emissions. Per person, that’s 21.7 tonnes of CO2 equivalent a year – below the East Cambridgeshire average of 25.6. Like Mepal, Wentworth and East Cambridgeshire as a whole, its largest single source of emissions is road transport, but still below the district average. Housing is the second largest contributor, with agriculture and land use featuring less prominently than in the division’s more rural and less populated parishes.
What about consumption – emissions including all the things we buy and use, like food, clothing, heating and transport? That’s 19.6 tonnes per person per year in Witchford, which is higher than the East Cambridgeshire average. Unlike the district average, housing is in fourth place, while consumption of goods and services, travel, and food and diet are higher.
For more information about these calculations and how they work, visit https://impact-tool.org.uk/using-the-tool
This is the sixth in a series of posts about the ‘carbon footprint’ of the various parishes in the Sutton division. It uses https://impact-tool.org.uk/ which is a parish-level carbon emission estimator. This gives parishes and small communities usable data on their carbon emissions – the amount of carbon (or equivalent gases like methane) produced by our activities.
Territorial emissions are those directly produced by the parish – its buildings, transport, land, and other amenities.
Consumption emissions include the carbon from the things we buy and use which are brought into the parish from elsewhere.
The website also shows carbon emissions for each of those two options in total, and also per household. You can also compare parishes with other parishes in the area, with the district council average, and with the national average.
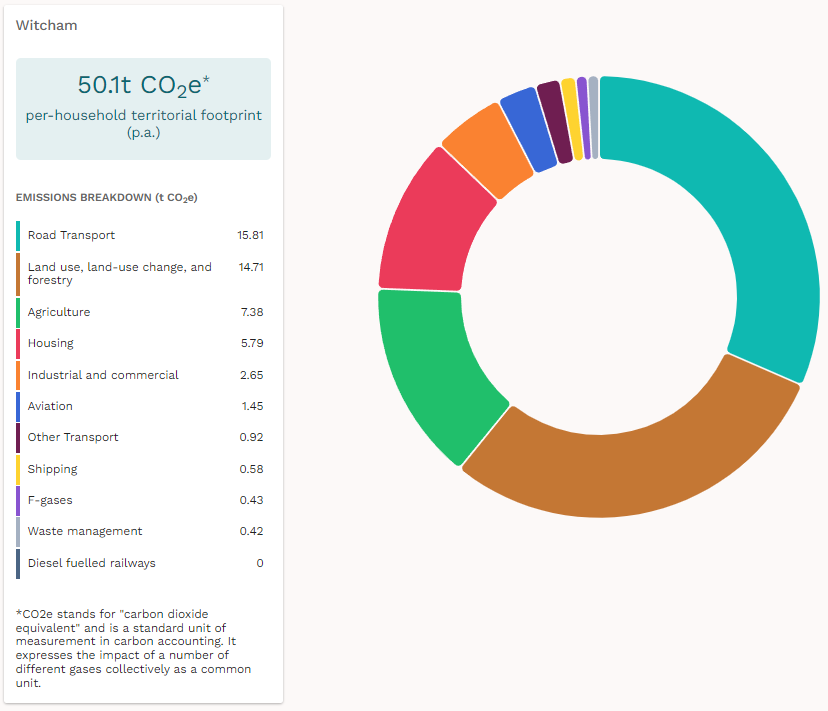
So, Witcham, which generates just over one per cent of East Cambridgeshire’s total carbon emissions. Per person, that’s 50.1 tonnes of CO2 equivalent a year – just under double the East Cambridgeshire average of 25.6. Unlike Coveney and Downham, but like East Cambridgeshire as a whole, its largest single source of emissions is road transport, at more than twice the district average. Land use is more than three times the East Cambridgeshire average, agriculture more than twice, and housing is somewhat higher too.
What about consumption – emissions including all the things we buy and use, like food, clothing, heating and transport? That’s 22.1 tonnes per person per year in Witcham. The parish scores higher than the East Cambridgeshire average for every item in the list below other than waste, for which it’s just fractionally above average.
For more information about these calculations and how they work, visit https://impact-tool.org.uk/using-the-tool
This is the fifth in a series of posts about the ‘carbon footprint’ of the various parishes in the Sutton division. It uses https://impact-tool.org.uk/ which is a parish-level carbon emission estimator. This gives parishes and small communities usable data on their carbon emissions – the amount of carbon (or equivalent gases like methane) produced by our activities.
Territorial emissions are those directly produced by the parish – its buildings, transport, land, and other amenities.
Consumption emissions include the carbon from the things we buy and use which are brought into the parish from elsewhere.
The website also shows carbon emissions for each of those two options in total, and also per household. You can also compare parishes with other parishes in the area, with the district council average, and with the national average.
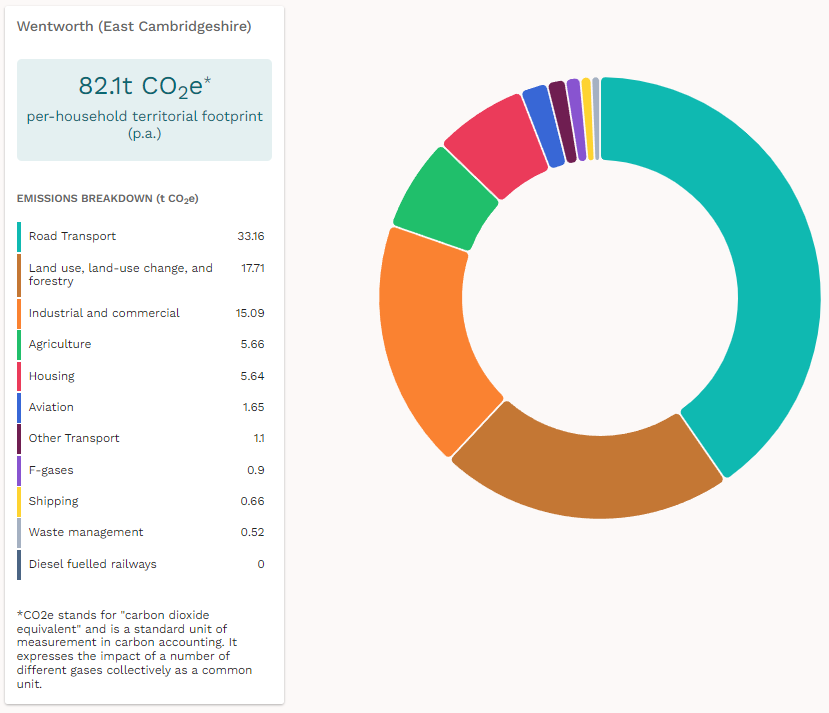
So, Wentworth, one of the smallest villages in the Sutton division which generates just 0.68 per cent of East Cambridgeshire’s total carbon emissions. But per person, it packs a punch at 82.1 tonnes of CO2 equivalent a year – more than three times higher than the East Cambridgeshire average of 25.6. Like Mepal, its largest single source of emissions is road transport, at nearly five times the per person average for East Cambridgeshire. Land use agriculture, industrial and commercial are also considerably higher.
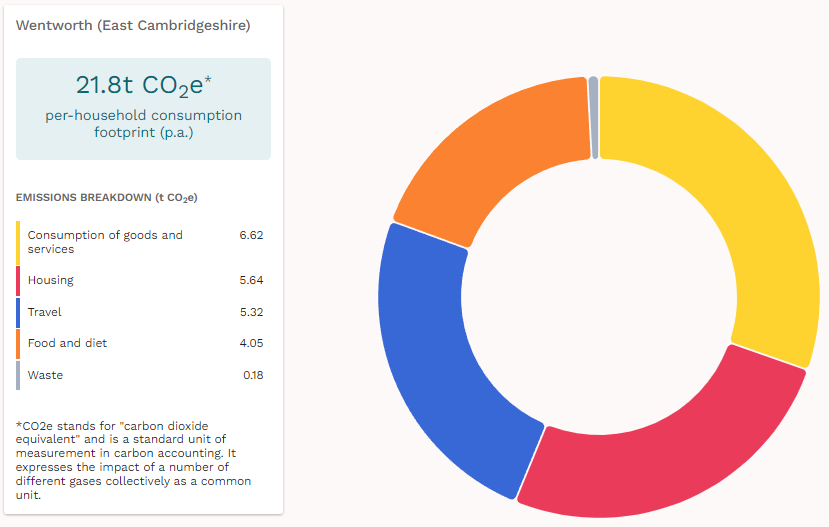
What about consumption – emissions including all the things we buy and use, like food, clothing, heating and transport? That’s 21.8 tonnes per person per year in Wentworth, above the East Cambridgeshire average of 18.4. Every item on the list below is somewhat above the district average, other than waste which is marginally less.
For more information about these calculations and how they work, visit https://impact-tool.org.uk/using-the-tool
This is the fourth in a series of posts about the ‘carbon footprint’ of the various parishes in the Sutton division. It uses https://impact-tool.org.uk/ which is a parish-level carbon emission estimator. This gives parishes and small communities usable data on their carbon emissions – the amount of carbon (or equivalent gases like methane) produced by our activities.
Territorial emissions are those directly produced by the parish – its buildings, transport, land, and other amenities.
Consumption emissions include the carbon from the things we buy and use which are brought into the parish from elsewhere.
The website also shows carbon emissions for each of those two options in total, and also per household. You can also compare parishes with other parishes in the area, with the district council average, and with the national average.
So, Sutton, which generates just over three per cent of East Cambridgeshire’s total carbon emissions. Per person, that’s 17.1 tonnes of CO2 equivalent a year – considerably less than the East Cambridgeshire average of 25.6. Like Coveney and Downham, its largest single source of emissions is land related, due to its farming hinterland. Road transport is less than half the East Cambridgeshire average.
What about consumption – emissions including all the things we buy and use, like food, clothing, heating and transport? That’s 18.4 tonnes per person per year in Sutton, exactly the East Cambridgeshire average. The travel impact of Sutton’s activities is slightly more than the district average, and the housing impact slightly less.
For more information about these calculations and how they work, visit https://impact-tool.org.uk/using-the-tool
This is the third in a series of posts about the ‘carbon footprint’ of the various parishes in the Sutton division. It uses https://impact-tool.org.uk/ which is a parish-level carbon emission estimator. This gives parishes and small communities usable data on their carbon emissions – the amount of carbon (or equivalent gases like methane) produced by our activities.
Territorial emissions are those directly produced by the parish – its buildings, transport, land, and other amenities.
Consumption emissions include the carbon from the things we buy and use which are brought into the parish from elsewhere.
The website also shows carbon emissions for each of those two options in total, and also per household. You can also compare parishes with other parishes in the area, with the district council average, and with the national average.
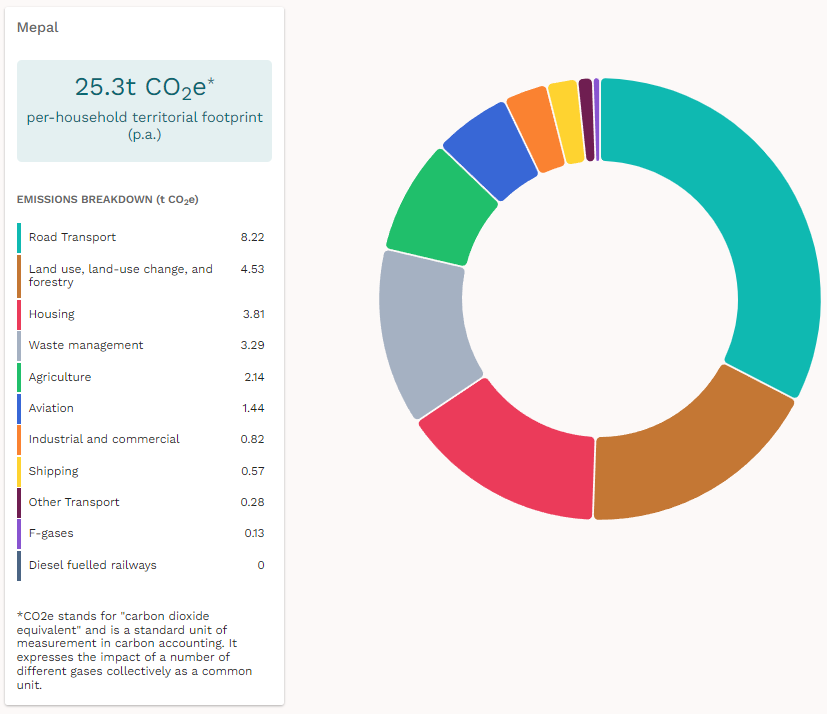
So, Mepal, which generates just over one per cent of East Cambridgeshire’s total carbon emissions. Per person, that’s 25.3 tonnes of CO2 equivalent a year – almost spot on the East Cambridgeshire average of 25.6. Unlike Coveney and Downham, but like East Cambridgeshire as a whole, its largest single source of emissions is road transport, as a result of the A142 running through it.
What about consumption – emissions including all the things we buy and use, like food, clothing, heating and transport? That’s 16.9 tonnes per person per year in Mepal. It’s the only parish in the Sutton division with lower per person carbon emissions on a consumption basis than the East Cambridgeshire average. The parish scores lower than the East Cambridgeshire average for every item in the list below other than waste, for which it’s exactly average.
For more information about these calculations and how they work, visit https://impact-tool.org.uk/using-the-tool
This is the second in a series of posts about the ‘carbon footprint’ of the various parishes in the Sutton division. It uses https://impact-tool.org.uk/ which is a parish-level carbon emission estimator. This gives parishes and small communities usable data on their carbon emissions – the amount of carbon (or equivalent gases like methane) produced by our activities.
Territorial emissions are those directly produced by the parish – its buildings, transport, land, and other amenities.
Consumption emissions include the carbon from the things we buy and use which are brought into the parish from elsewhere.
The website also shows carbon emissions for each of those two options in total, and also per household. You can also compare parishes with other parishes in the area, with the district council average, and with the national average.
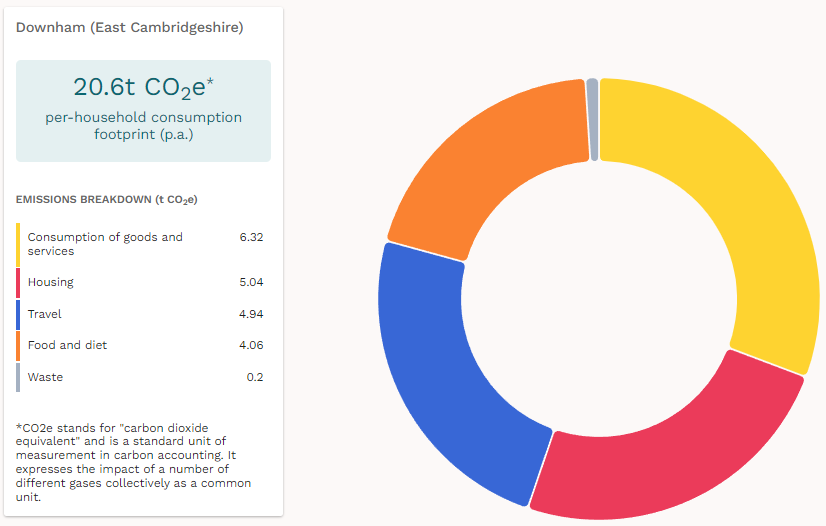
So, Little Downham, which includes Pymoor – if you want to check the estimator for yourself, you’ll need to enter ‘Downham’ as the parish name. The parish generates around four per cent of East Cambridgeshire’s total carbon emissions. But per person, it generates 35.5 tonnes of CO2 equivalent a year – forty per cent more than the East Cambridgeshire average. Like its smaller neighbour, Coveney, that’s because as a rural community a significant portion of its emissions are from land use and agriculture. But its housing contributes less carbon per person than Coveney, and road transport contributes more.
What about consumption – emissions including all the things we buy and use, like food, clothing, heating and transport? That’s 20.6 tonnes per person per year – rather less than in Coveney. And again like Coveney, higher than the East Cambridgeshire average of 18.4 tonnes – but only slightly so. The cause is more generally spread, with each item in the list below slightly higher than the East Cambridgeshire average.
For more information about these calculations and how they work, visit https://impact-tool.org.uk/using-the-tool